As many of our Administrators know, Zimbra Collaboration Suite logs just about everything. One of the most integral is the mailbox.log located in /opt/zimbra/log .
In this Administrator’s PowerTip, we’ll cover some common entries in the mailbox.log file, and what they mean.
*Note- This is an administrator PowerTip intended for System Administrators of Zimbra Collaboration Suite.

Administrator’s PowerTip #1: May 7, 2007
Zimbra Forums – Zimbra wiki –
Introduction
 Zimbra Collaboration Suite leverages the power of many different applications to deliver the best, and most advanced user experience available. Most of these have been rigorously tested to insure that they can survive in a high demand production environment.
A good example of this high demand production environment, is the partnership with Comcast that Zimbra reached.
However, sometimes things can go wrong. The symptoms can very, and the logs should be the very first resource to finding out what’s happening.
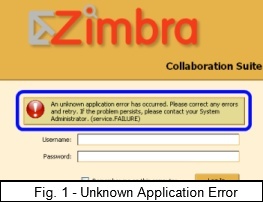
In Fig. 1, we see that tomcat has started, but the user cannot login.
/opt/zimbra/log/mailbox.log – General Notices
In ZCS version 4.5, we changed the /opt/zimbra/log/zimbra.log to /opt/zimbra/log/mailbox.log to avoid confusion with another Zimbra log.
This is a particularly powerful log that contains much information to help out a system administrator.
On a normally functioning system, this log file will log items such as authentication sessions, POP3/IMAP/SOAP access, and blob file stores. More importantly, it logs most errors such as authentication, ssh, tomcat, and other failures.
In the above snippet, we see an informational message about a delivery. In order, we have:
Date; Time; Type of Message; LMTP=Local Mail Transport Protocol; Thread #; User account that triggered the message.
The above message is more of an informational message, than an error message. There is also the WARN notice which is for warnings.
/opt/zimbra/log/mailbox.log – Exceptions & Stack Traces
In this example, we see that there has been an exception. An exception is an event, which occurs during the execution of a program, that disrupts the normal flow of the program’s instructions.
To most, this is Greek, but it’s actually quite informational!
We see that someone has logged in, and an error was detected. in order, we have:
Date; Time; Type of Message; Protocol-Port-Thread; User Agent; Error
In some cases, Zimbra will log a tomcat stack trace for more information. This becomes quite handy to post in our forums. In this case, the stack trace tells us that there is not a folder ID 890.
With a stack trace, always look for a “Caused By” line. This will tell you the root of the error.
In the above example, there won’t be a “Caused By” error because the error is caused by a user trying to access a non-existent folder.
/opt/zimbra/log/mailbox.log – Security
Security is a must. System administrators need to know if an unauthorized person/bot is trying to get into their system.
Mailbox.log will log any successful or unsuccessful login attempts via IMAP/POP3/SOAP
In the above example, someone (someone@yourdomain.net ) has attempted to login to the server, but the authentication has failed. Important information such as the IP address, and the affected account are included.
For diagnostic purposes, a stacktrace is included. If you see a lot of these entires, then it is likely that you are victim to a brute force attack, or just a user who doesn’t know their password/Caps light is on.
For a more detailed security log, take a look at /opt/zimbra/log/audit.log
/opt/zimbra/log/mailbox.log – Tomcat failure
The above examples are common informational messages. Let’s look at some errors. An common error is to enable the IMAP Proxy service without configuring it. Because that service runs most commonly runs on port 80, this can cause a conflict with tomcat which also most commonly runs on port 80.
At first, the IMAP Proxy won’t start because it is attempting to bind to a port that is already in use. However, if the server reboots, IMAP Proxy will start before Tomcat. This means that when Tomcat tries to start, it won’t be able to bind to port 80, thus, no one can access Zimbra. In the above example, we see all of the Zimbra services running, except Tomcat, which handles the Zimbra Web Client.
There are also many other things that can bind to port 80, like Apache’s httpd service (only typical if you don’t use ssl/port 443).
Unfortunately, this won’t be logged into the mailbox.log, but will be logged in catalina.out.
/opt/zimbra/log/mailbox.log – Finding your error
As you’ve noticed, just about everything is logged into this log file. Sifting through the log can be difficult.
It might be good to clear the log by running:
cat /dev/null
> /opt/zimbra/log/mailbox.log
Then rerunning the operation that is causing the error.
The grep command along with a pipe, can be useful:
cat /opt/zimbra/log/mailbox.log | grep exception
Conclusion
There is a lot more to this log, that isn’t documented here. We’ll be posting more on that later.
The mailbox.log won’t log service status, so if LDAP fails to start, it won’t be logged here. Each service has it’s own log file (which we’ll cover later).
Remember that the mailbox.log is a “runtime” log, so it will log mostly runtime events.
The forums can be your best friend when it comes to troubleshooting. Just search for your error using Zimbra’s advanced searching feature, and you’ll probably find an answer. If not, then please post your issue.
Don’t forget to include the mailbox.log in your post.

Comments are closed.